Market profile patterns to watch for
Market Profile Patterns to Watch For in Prop Trading
Introduction
On busy trading days, the market feels like a crowded auction. Market profile gives you a map: where price spent most of the day, where it accepted or rejected, and how the crowd shifted its mind. I’ve found this lens helps across FX, stocks, crypto, indices, options, and commodities—especially when liquidity is thin or volatility spikes. When you start spotting value areas, POC levels, and distribution shapes, decisions feel less like guesswork and more like reading a room.
Body
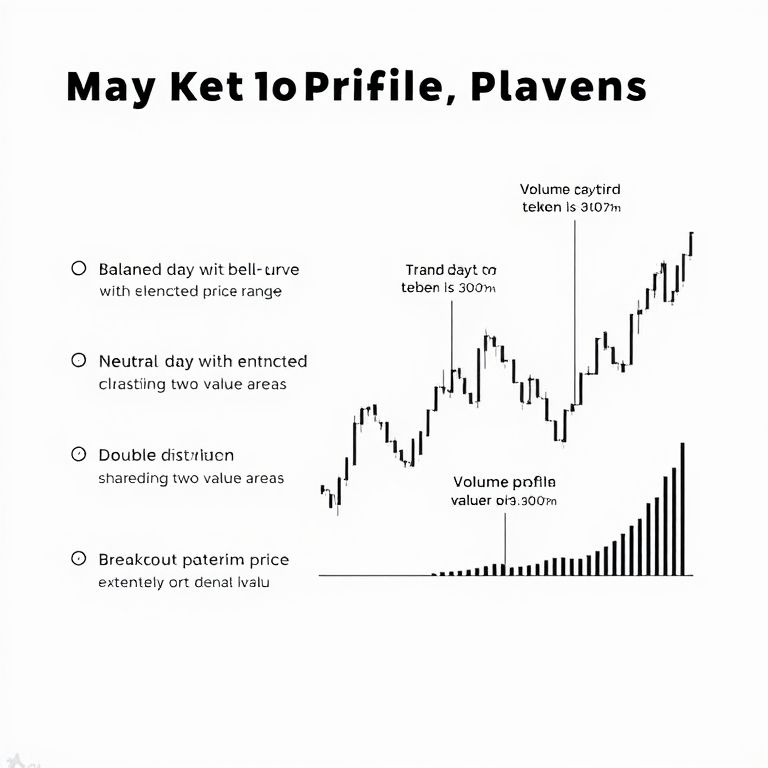
What Market Profile brings to the table
- It paints where traders agreed to value price and where they weren’t sure. The value area, the point of control (POC), and the shape of the daily distribution tell you if buyers or sellers dominated, and for how long.
- It’s the kind of framework that travels across markets. The same concepts—balanced distributions, imbalances, and breakouts from value—show up in forex sessions, stock indices, crypto bursts, and even commodity days.
Key patterns to watch
- Value area breakout: when price leaves the value area with conviction, it often signals the next leg. A break followed by sustained volume can hint at trend days or rapid shifts in sentiment.
- POC reactions: a market may wander around the POC for hours, then commit. If price repeatedly tests the POC and fails, that level becomes a magnet or a wall, depending on the context.
- Single prints and gaps: a quick, low-volume print in an otherwise orderly day can foretell a fast move as a new consensus forms.
- Balanced vs imbalanced profiles: a balanced day suggests a fair auction with no strong bias; an imbalanced day implies directional pressure and potential follow-through if the trend gains steam.
- Double distributions and trend days: two distinct peaks suggest competing interests; a steady trend day shows disciplined participation but can reverse with a liquidity flare or macro surprise.
- Cross-asset consistency: when several assets align in their profile signals (e.g., EURUSD and SPX futures both hint at a value-area test), the odds of a meaningful move rise.
Across assets: what to expect
- Forex often exhibits sharp value-area shifts around major data or central-bank cues; profiles can hinge on liquidity clusters in sessions.
- Stocks and indices show pronounced value areas around earnings, macro data, or rate expectations; distribution shapes can tighten or widen with volatility.
- Crypto tends to produce more impulsive single prints and quicker POC re-alignments due to intraday liquidity and retail participation.
- Options and commodities amplify the same patterns but with volatility from skew, open interest, and macro-driven volatility surges.
- The lesson: adapt the time window, keep an eye on liquidity, and calibrate expectations for how fast profiles can morph.
Reliability and practical strategies
- Combine Market Profile with other signals: price action, volume, and order flow help confirm whether a pattern is actionable.
- Timeframe discipline: use a primary profile on a higher timeframe (e.g., daily) to frame the bias, and a secondary profile on a shorter window to time entries.
- Risk controls: cap a trade by volatility-adjusted stops, maintain modest position sizes, and backtest across regimes to avoid overfitting.
- Real-world setup: in a volatile morning, a shift in value area toward a new region can justify a pivot in asset allocation across your desk, not a single instrument bet.
- Learn from experience: journal how often a pattern led to a follow-through, then weight those patterns more or less in your future plan.
DeFi today: development and challenges
- Decentralized finance has accelerated on-chain liquidity and programmable trading, but fragmentation and MEV (miner extractable value) risk complicate predictable execution.
- On-chain order books and layer-2 trading show potential for Market Profile-inspired strategies, yet gas costs, front-running, and cross-chain latency demand careful engineering.
- The takeaway: DeFi is a promising lab for automated, profile-driven rules, but use robust risk controls and monitor on-chain realities rather than assuming traditional liquidity will transfer cleanly.
Future trends: smart contracts and AI in trading
- Smart contracts can encode Market Profile logic for automated, rules-based entry and exit, improving consistency in repeatable markets.
- AI and machine learning can digest long histories of profile shapes, correlating with macro regimes and liquidity shifts. The risk is model drift and adversarial data—keep human review in the loop.
- The combination—on-chain execution with AI-driven decisioning—could raise the bar for speed and discipline, but it also elevates the need for governance and risk oversight.
Prop trading outlook
- The demand for pattern-driven, cross-asset strategies remains strong as funds push for alpha in diverse markets.
- Capital efficiency and data-driven decision-making will keep Market Profile-inspired methods relevant, provided traders stay adaptable to market structure changes and data quality.
- A practical mindset: build robust workflows that test patterns across regimes, not just in sunny markets.
Slogan and takeaways
- Market Profile patterns: read the crowd, ride the move, protect the ship.
- When value area shifts, adjust the stance; when POC holds, let the trade prove itself.
- Across futures, spots, and chains—pattern-aware trading scales with competence, not with hype.
If you’re building a prop desk or your own toolkit, start by mapping value areas across your favorite assets, test how patterns behave in calm versus storm days, and stay flexible as DeFi, AI, and smart contracts reshape the playing field.


